
Taking performance analysis to the system level
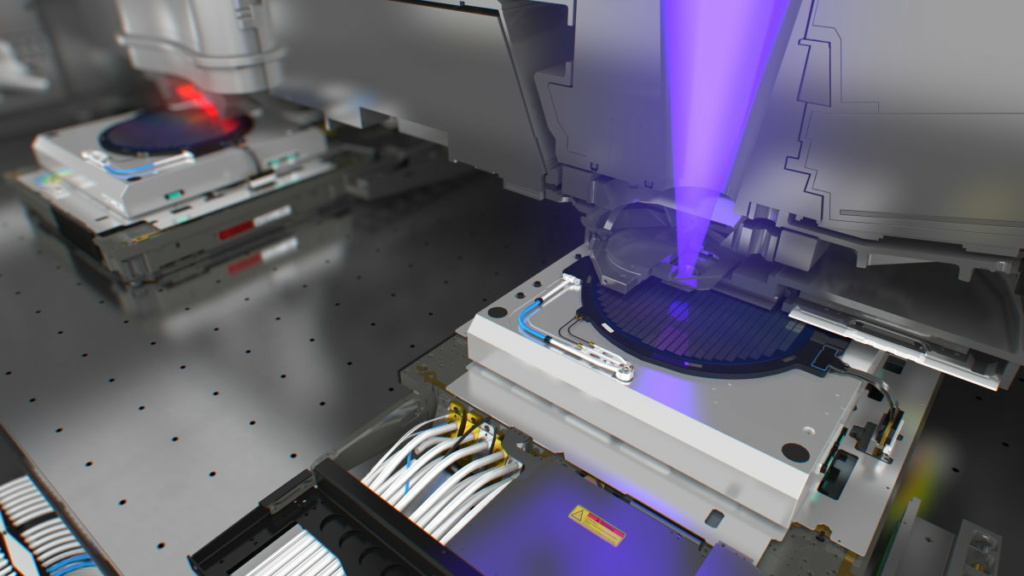
With every new generation of lithography machines, better focus and overlay are required to print smaller chips. Accordingly, the number of software tasks and their complexity increases tremendously, impacting the performance of the system. “As the chip details get smaller, we need to do more corrections and more calculations,” explains Jos Vaassen, software product architect at ASML. “At the same time, we’re allowed fewer timing errors because with even the slightest time difference, there will be a temperature variation causing material expansion or shrink, as a result of which we lose focus and overlay.”
To ensure that performance targets are met, ASML and TNO-ESI, in collaboration with Eindhoven University of Technology (TUE), have been looking into an approach to diagnose the system behavior and quickly find and analyze the root cause of anomalies. In the Concerto project (2016-2019), the partners developed a model-based methodology to scrutinize the software execution and keep computational tasks out of the critical path as much as possible. “The aim of Concerto was to make problem-solving in our machines way easier by automatically detecting software hiccups, gathering data and then reconstructing from that data what exactly happened when the issue occurred,” summarizes Vaassen.
As a follow-up, the Maestro project (2020-2023) takes the methodology to the system level. “Most of the productivity issues in the field are directly dealt with at the customer. Only a fraction is passed back to Veldhoven. Unfortunately, performance anomalies related to the execution of the software don’t immediately end up in the right place there, as the support team operates on a system level and has no intimate software knowledge. Consequently, those issues take longer to resolve,” notes Kostas Triantafyllidis, research fellow at ESI. “With Maestro, the aim was to streamline troubleshooting by connecting observed anomalous system behavior to software root causes, so that software-related issues can be easily delegated to the appropriate team.”
Proof-of-concept
The approach developed within Concerto starts with collecting data about the system execution. To that end, the machine software is instrumented at strategic locations by adding little bits of measurement code there. For every software component, this makes it possible to track the starting and stopping times of the functions being executed and the messages being passed to other components.
From these traces, so-called timed message sequence charts are generated – Gantt-like diagrams that plot the software components against the functions they execute over time, supplemented with arrows depicting task dependencies. They provide the formal foundation for the final step of automated performance analysis. Different mathematical techniques can be applied to them, not only to calculate the critical path and find the root causes of bottlenecks but even to formally verify system properties.
The analysis and visualization are done by a purpose-built tool, called Twinscan-integrated Platform Performance Suite (T-iPPS). “It’s a proof-of-concept, tailor-made for ASML,” says Triantafyllidis. “It’s made up of a generic part, the Platform Performance Suite or PPS, which can be applied at other ESI partners. Sitting on top of this is a layer of concepts specific to the domain of lithography systems to make the outcome of the tool understandable for people at ASML.”


Instant success
The adoption of the new instrument took some time and effort. “We went through a number of phases,” Vaassen recalls. “The Concerto research project was the feasibility phase where we added the measurement probes to our code, built the suite on top of that and showed that we could use the data to improve our software. In the optimization phase, we minimized the performance impact of T-iPPS, aligned it with the rest of our tool stack and ensured its seamless collaboration with the 60,000 auto testers we run on our code. Finally, when we were confident that the added diagnostics wouldn’t have a noticeable impact on customers, we integrated it into our production code.”
Operational since May of 2022, T-iPPS is already proving its worth. “Last year, we had an internal issue that luckily didn’t end up in the field,” illustrates Vaassen. “As we were deploying a new software release, we ran into a problem on an EUV system. Looking at it from their normal system-level perspective, the productivity team couldn’t find the cause. After a couple of days, they asked the Maestro team for help. The Maestro team then ran the tooling on a test bench, not even on an actual machine, and within one hour, they were able to pinpoint the software component that was causing the trouble and direct the productivity team to the engineering team that could solve it.”

Vaassen gives another example. “Recently, we had the first big case where we collected field data, analyzed it and used the result to solve a problem at a customer. We saw three things going wrong: we had a control process that was severely impacted, one that was slightly affected and we had a small memory leak, which would render the system out of memory in a year or so. Customarily, we would have given priority to the biggest impact, but the data from T-iPPS suggested addressing the memory leak first. And indeed, that turned out to be the root cause of all issues. It still took some time and effort to actually tackle it, but once we had resolved it and had rolled out a patch to the field, there was instant success.”
Software blueprint
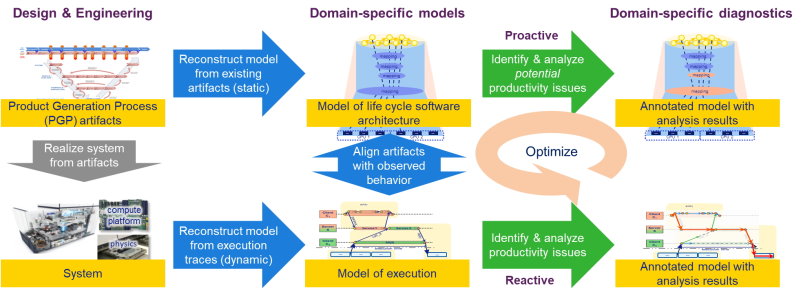
Meanwhile, Maestro built on the results of Concerto. “The follow-up project had two main objectives,” Triantafyllidis elaborates. “One was to bring the tool’s usability to the system level so that it can be applied earlier in the support chain. The other was to see if, eg from test scenarios, we could make predictions about system performance and prevent issues from arising by adjusting the software execution. Moving a process to another host could prove very beneficial, for example. Ultimately, we want to identify and analyze productivity issues reactively as well as diagnose potential problems proactively.”
Taking T-iPPS to the system level for the reactive part required some technical work and some methodological adaptations. “On the one hand, we had to put a bit of effort into linking system-level observations to nanosecond-scale software behavior,” details Triantafyllidis. “On the other hand, we had to make some small changes to how we do the root cause and critical path analyses. At a higher level of abstraction, the concepts and methods translate slightly differently to our modeling formalism of timed message sequence charts. With the connections to the system in place, T-iPPS allows you to go as deep as you want but also as high as you want.”
For the proactive part, the work is still ongoing, Triantafyllidis points out. “We’re trying to tackle the system complexity by modeling it automatically based on the system artifacts and the interrelations observed during execution. You could say that we’re building a blueprint for ASML’s machine software. Once we have that, we can tune the variation points to optimize the system.”
Strong case
As the Maestro project is in its final year, the partners are moving toward system-level adoption. One of the remaining challenges is multi-host integration. Triantafyllidis: “Our proof-of-concept works for the main subsystem, the scanner, but a typical ASML machine has up to thirty different hosts talking to each other, including the wafer stage and the reticle handler. We’re in the process of introducing T-iPPS tracing there as well. This will give us complete insight but also brings the challenge of synchronizing the events from the different hosts, as their clocks may drift. Effectively, we need to create an integrated timed message sequence chart. We hope to have this finished by the end of the year. The first implementations are very promising.”
Another work in progress is automatic troubleshooting, eg when comparing the performance before and after a software upgrade. “A perceived difference of seconds on the system level can ultimately be due to the software execution being off a couple of microseconds or less. Even with T-iPPS, when zooming in so many orders of magnitude, it’s extremely difficult for a human to keep the overview,” Vaassen explains. It’s like finding a needle in a haystack of 200 million events per hour. The partners are confident that they’ll have this automated by the end of the year as well.
Once these challenges have been addressed, Vaassen expects adoption to go fairly smoothly. “I’m sure that the process will take less time than with Concerto. We still need to do some convincing that this is really valuable – and a lot of training because it’s a super elaborate tool. However, with all the positive experiences from the previous project and the several success stories we’ve collected already, we’ve built a very strong case to get the tracing in, the viewer industrialized and the people warmed up to be taught how to use it.”
Widespread use
As a testament to ESI’s mission to help advance the whole high-tech ecosystem, the approach is also making inroads at other industrial partners. “PPS, the generic part, has been applied in the Archviews research project at Thales,” says Triantafyllidis. “And in the Transact research project, TUE is successfully applying the methodology in the interventional X-ray machines of Philips.”
“We’re working toward a modular setup with PPS as the core,” Triantafyllidis concludes. “Companies can take this core and tailor it to their cyber-physical systems by building domain-specific concepts on top of it, as we’ve done with ASML to create T-iPPS. We’re now in the process of open-sourcing it to facilitate widespread industrial use.”
This article was written in close collaboration with TNO-ESI. Main picture credit: ASML


